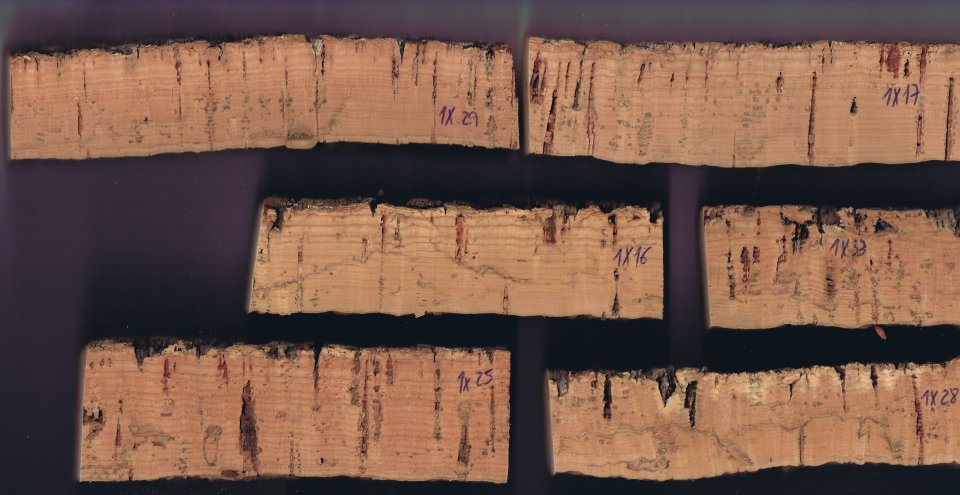
The thickness of cork oak trees varies highly, even when they are located in the same geographical location or stand. The objective was to research how climate variables affect different trees within the same site, for which precipitation and temperature variables were considered. The response variable was the cork growth index (cgi) – the cork thickness of the first eight complete growth years were measured after boiling. The differences between trees were characterised by nine different cork thickness quantiles, from lower (thinnest cork) to higher (thickest cork).
The thickness of the extracted cork is a determinant of its price. There is a need to define tree management strategies that contribute to the increase in the amount of suitable cork extracted for stopper production, and ultimately farm income. Modelling cork growth index as a function of climate variables was carried out based on a quantile regression methodology, considering nine quantiles, from lower (thinnest) to higher (thickest). This was done using a large data set collected from 35 stands, located across the cork oak distribution area in Portugal.
- A downward parabolic response to the average annual precipitation was found for all cgi quantiles, with the precipitation values that maximise cgi varying from 925 mm for the first quantile to 790 mm for the ninth quantile. These values are below the maximum found in the data set for the average annual precipitation in the cork growth period: 946 mm.
- The maximum annual temperature was shown to be negatively correlated with cgi for samples under the 60th quantile.
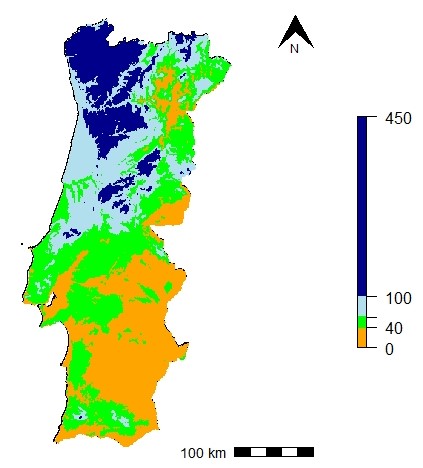
- The Lang index (ratio between the average annual precipitation and temperature) demonstrated a downward parabolic relationship with cgi for all quantiles. The cgi was maximised for the Lang index value to around 47.5, characterising semi-arid climate conditions.
- Consider the value of the Lang index as an indicator of cork productivity. Remember that values around 47.5, corresponding to semi-arid climates, are associated with the best cork growth conditions.
- Define recommendations for debarking periodicity and intensity, considering: local and sanitary conditions and cork thickness of each tree (assessed in terms of visual observation of cork sampling during the debarking).
- Consider the postponing of debarking and decrease of debarking heights in years characterised by low annual precipitation (drought) and/or high maximum temperatures (heat waves), in particular for trees with a cgi value under 26 mm (60th quantile of the present data set).
Knowledge regarding cork oak’s response to edaphoclimatic variables is still limited and focused on the average tree. The results presented show that the response is different for different trees, particularly in relation to precipitation and maximum temperature.
The results show an optimal response of cork growth index (as a proxy of cork thickness) to precipitation between 790 mm and 925 mm. Since the data set used is characterised by a maximum value of 946 mm, extrapolation to higher precipitation values should not be done.
The present research will be further developed, taking advantage of the long-term permanent plot network, spread across the cork oak distribution area in Portugal. Subsequent steps will include researching the relationship between cork growth and soil variables.
The establishment of monitoring trials in the central and northern coastline regions of the country will also contribute to the increase of the range of observed variables.
Joana Amaral Paulo, joanaap@isa.ulisboa.pt
Further information
Paulo, J. A., Firmino, P., Faias, S. P., Tomé, M. 2021. Quantile regression for modelling the impact of climate in cork growth quantiles in Portugal. Accepted for publication. European Journal of Forest Research.
Joana Amaral Paulo (ISA)

Distribution of the Lang index values in Portugal (Paulo Firmino / ISA).
